

 CAPITALAND LIMITED (SGX:C31)
Singapore Strategy 2019 - Need Retail Therapy? Buy Local!
Rollercoaster ride
- Global equities had a major rollercoaster ride this year, from heady highs earlier in the year to panic lows by the last quarter of the year. While there were the usual pockets of geopolitical tensions and politically tense situations, trade tensions and tariffs between the US and China hogged the limelight, and escalated in 2H18.
- Selling was widespread, across markets, assets and almost all sectors, share price fluctuations were wide. US equities bucked the downtrend, while Asia bore the bulk of the selling pressure.
Cautious outlook
- There was no refuge from the selling pressure this year and there was a flight to defensive sectors and safety as investors focused on some of the core holdings offering stable earnings and strong balance sheets.
- Fortunately, 3Q corporate earnings were fairly in line with expectations and there were minimal earnings shocks or cuts. In general, guidance from listed companies was muted and earnings outlook for 2019 was pared down in anticipation of slower growth next year.
Pricing for pessimism; time to shop
- With the price correction in 2018, current valuations have become attractive. Corporate earnings growth for 2019 is estimated at 7.1%, with PER of 12.1x and with an attractive dividend yield of 4.3%. In terms of PER, the STI is currently trading at close to historical trough levels and also -1 standard deviation below 7-year average. At these valuations, we believe smart money and longer term value investors will be re-entering the market soon.
Topsy turvy with wide fluctuations
US$15 trillion gone!
- From 2018 peak to trough, about US$15 trillion were wiped off from global equity markets (based on Bloomberg estimates). This staggering amount also meant that markets generally had a short-lived rally from late 2017 to early 2018 before crashing to the lowest level in Oct 2018. There were several unfavorable factors in the market, chiefly centered on the on-going trade tensions between China and the US, which escalated in 2H18.
Uncertainty in other countries
- Apart from trade war, there were other issues including the collapse of the Argentine Peso, the crisis in Turkey, the contraction of the South African economy, the weakness of the Indonesian Rupiah, Italy’s debt-driven deficit, volatility in the UK due to Brexit and the widening of the US trade deficit with China. It is increasingly apparent that volatility is the new norm.
Singapore fell in tandem
- In Singapore, the market went through the same cycle, largely tracking the key North Asian markets and gyrated widely falling 18.5% from 2018 peak to trough and down 7.3% YTD based on the STI.
Recent buzz words: Cold war, late cycle and bear market
Bear market scenario?
- In recent weeks, more market participants are anticipating a cold war and predicting a bear market. Despite this, the US stood out uniquely as a key market that bucked the wider down trend and posted gains while the rest of the world languished.
- Since trade tariffs started in mid-2018, the S&P 500 Index (SPX) has managed to hold on to YTD gains and only gave up some gains in late October and late November. Meantime, Asian markets bore the brunt of the selling. At the low, the MSCI Asia ex-Japan Index (MXASJ) was down 27.2% (from peak to trough) and is currently down 12% YTD. Based on the current SPX’s gains of 1.0% YTD versus -12% for the MXASJ, the difference amounted to 13%. The differential has increased to one of the widest levels in recent years, especially from June 2018 onwards.
Trade war: Will it become a protracted event?
- With the firing of the first salvo in June 2018, when the US announced a 25% tariff on up to US$50b of Chinese products and China responded with a 25% tariff on US$34b of US goods, it is now becoming increasingly possible that this trade war could potentially stretch for a prolonged period, with some expecting this to last as long as 5-10 years. Electronics, machinery and textiles are some of the key imports from China into the US and there are expectations that some of the production will be shifted out of China into the region. However, even if companies are planning to consider alternative manufacturing bases, we believe that this will still take a while to effectively execute the relocation. If it does, Southeast Asia is a likely alternate production hub.
- With multi-factor unknowns at this moment, we believe that the market is pricing in this uncertainty. We consider several possible outcomes:
- If there is a speedy end to the trade situation, equity markets could enjoy a quick relief rally.
- If more tariffs are imposed, the economic impact on China’s growth is estimated to range from -0.9% to -1.5% (see exhibit on the right) and could result in further weakness for equities.
- If option 2 happens and there are steps to intervene and support the Chinese economy, it could also be a short-lived correction, which will also see the same effect for the Singapore market, which has tracked the North Asian markets in recent months.
- However, if the worst case scenario happens and this drags on, it could hurt economic growth and result in further corporate earnings cuts, which could be negative for the Singapore market.
PMIs have been edging lower.
Cut in PMI and confidence
- With the trade tensions, which escalated in 2H18, the Eurozone PMI and the Chinese PMI numbers have eased off. With cuts in economic growth forecasts by the IMF and other agencies, and together with expectations of a slowdown in trade, PMIs could ease off further in the months ahead.
- In addition, the US Conference Board Consumer Confidence Business Conditions index (CONCBUNO) has also come off in recent months. It stood at 47.9 in November 2018 compared to 52.0 at the beginning of the year. This is also the lowest level in 2018. The last time it was below 48 was in 2011.
IMF cut growth forecast
Slower growth ahead
- With the trade tensions between US and China, the International Monetary Fund (IMF) cut its global growth forecasts in Oct 2018, largely to account for the impact on economic activity. As a result, global growth is projected to slow to 3.7% in 2018 and 3.7% in 2019. This is down 0.2% for 2018 and down 0.3% for 2019 from its earlier forecasts in April 2018.
- Of interest is that the ASEAN-5 growth estimate was left intact in 2018, and dropped by 0.2% to 5.2% in 2019. Emerging Europe, Latin America and Emerging Markets were the markets that saw cuts of more than 0.4% for the 2019 forecast.
ASEAN is fairly resilient
But some trade damage is coming through…
- Increasingly, China is a key market for ASEAN countries. China’s share of global GDP has grown from 3% in 1997 to about 15% in 2017 (based on IMF and Bloomberg estimates). With the cut in global economic projections, we believe that ASEAN and Singapore will not be spared, especially since China is a key trading partner of the ASEAN countries. On balance, we feel that Asia is in better condition to withstand the tough environment ahead.
- Apart from PMIs, China’s new export orders are also on a downtrend, another resultant impact from the ongoing trade tensions. The decline accelerated from August 2018 and this is the lowest level since early 2016.
Singapore: Will corporate earnings be cut?
3Q18 in line with expectations
- With the generally pessimistic market sentiment and tough business environment, how is Singapore positioned for the slowdown in global growth and the potential impact on corporate profitability? In addition, there are market expectations of between 1-3 rate hikes in 2019. While US earnings growth will come off in 2019, after the high growth in 2018 which benefited from tax cuts, the adjustments in Singapore are minor. 3Q18 corporate results were generally in line with market expectations and there were no obvious cuts in earnings or dividend payouts. While most Singapore-listed companies do derive the bulk of their earnings from the domestic markets, overseas markets are important and any slowdown will affect the earnings of Singapore corporates.
- Fortunately, based on estimates, the cut is not overly excessive in the last 3-4 months.
Singapore: Election year and pre-election goodies?
- With the recent announcement of the current Finance Minister Heng Swee Keat as Singapore’s next leader, it looks like election could possibly take place sooner than expected, although there is still time. The last election was held on 11 September 2015 and the next general election must be held by 15 Jan 2021. With future leadership settled, the next inevitable question is, will there be pre-election goodies in 2019?
- One key area of interest will be the residential property market. The July 2018 residential property cooling measures have dampened the outlook for developers in 2019 and there is the general wish for some of these cooling measures to be reviewed. However, we believe this is likely to stay since these measures were only introduced recently.
Singapore: Investment themes to ride out this uncertain period
- Investment Strategy:
- Stay with the defensives
- Selective exposure to certain REITs
- Look for value and high dividend stocks
- In Singapore, the STI is well represented by a few key sectors including financials, telecommunications and property. As the core STI companies are fairly established and have largely emerged fairly unscathed from the Asian Financial Crisis and the Global Financial Crisis, we believe that these firms will be well positioned to ride out any potential economic slowdown. Most have healthy balance sheets and are not overly geared. In addition, dividend payouts are consistent and healthy.
Singapore: Will there be a short term January effect?
Historically, Jan is a positive month
- Historically, in the last 20 years, July seemed to be the best month for Singapore equities while August was the worst. For August, there were 15 periods of declines versus only 4 periods of gains. On the up months, the trend is less clear although July enjoyed 14 periods of gains versus 5 periods of declines.
- In the last two years (2017 and 2018), the STI started the year with gains of 5.8% in Jan 2017 and 3.9% in Jan 2018. If the trend in the last two years continues, there is a possibility of investors welcoming in 2019 with gains for the market, especially after the more than 7% correction seen in 2018.
Singapore: Will M&A come into play in 2019?
M&A and share buyback
- Corporate activities and acquisitions have slowed recently. The IPO market has also slowed down in the last few months as companies pushed back listing plans. With the current market selldown, cash-rich founders or companies may use current weak market conditions to either beef up their holdings or acquire companies. However, we expect corporate actions to be concentrated in the mid-cap space, especially for companies with healthy balance sheets and sound business models whose stock trade below book values.
- Some of the STI companies have resumed share buybacks following the announcement of 3Q18 results. Of this, the three local banks are among the more active participants (See also: SGX Market Update: Banks Bought Back S$88 Million in Shares in November 2018). While the amount is fairly small versus total outstanding shares, the consistent buyback programmes this year is a positive signal, and typically, share buyback points to management’s confidence in the company’s prospects.
- See also consolidated list on latest share buybacks transactions of SGX listed companies.
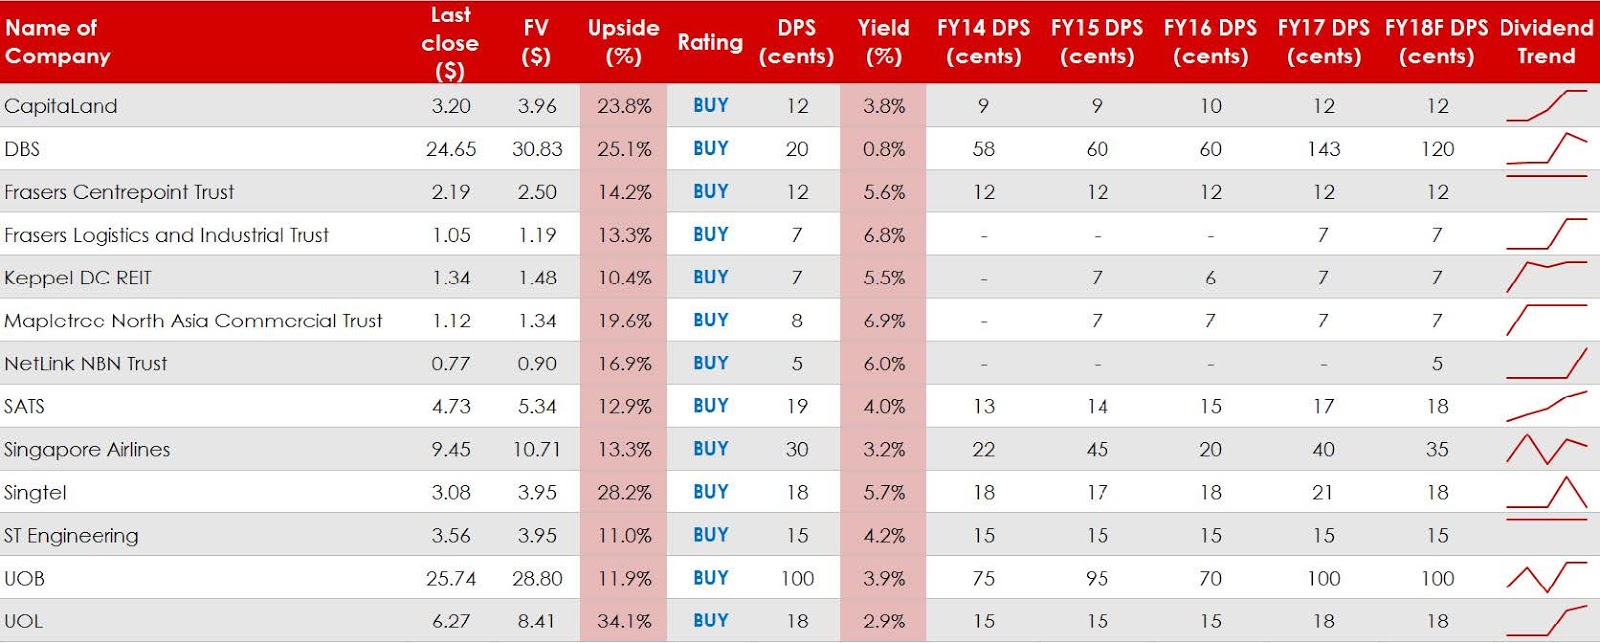
Singapore: Dividend stocks with consistent & growing payout since FY14
Allocate funds to dividend stocks
- Due to the volatile market conditions, another segment of the market warrants a re-look at current price levels. We have identified several companies which have consistently provided constant and gradually rising dividend payouts. This included CapitaLand (SGX:C31), DBS Group (SGX:D05), SingTel (SGX:Z74), Singapore Exchange (SGX:S68), ST Engineering (SGX:S63) and SATS (SGX:S58).
Fun Fact: Rallies are longer, declines are shorter
In the last two decades, market uptrends tend to last longer than the down-cycles.
- Since 1990, and based on the S&P 500 index, there were three periods of declines and three periods of rallies. In generally, the rallies (56-118 months) lasted longer than market down-cycles (5-25 months).
- Similarly, for the Singapore market, up-cycles tend to last longer than down-cycles. Since 2000, up cycles lasted an average of 31 months, while down cycles averaged 13 months, or a ratio of 2.5.
Impact on STI: Scenario analysis ~ Base, Bull and Bear
- We have taken this into consideration and included this in our analysis of the impact on the Singapore market. In our base case, based on 7% earnings growth and 7-year historical average PER of 13.9x, the STI should trade around 3632, a potential upside of 17% from current levels. However, assuming the worst case scenario, with PER of 11.0x, the STI should trade at 2859, a potential downside of 8%.
- With current uncertainty, with more downside bias, we expect the STI to likely trade between the 2800 to 3200 levels.
Valuations: Reasonable, focus on value stocks
Value over growth
- On the global front, several broad themes may continue to play out including digital and mobile payments, gaming and online sports, the popularity of co-working space, heightened defense spending, continued emphasis on education and the environment. However, on the domestic front, the more pertinent factors will be the re-making of the domestic economy. As Singapore re-makes to be a smart nation, there will be more initiatives to drive this, but we believe that traditionally deemed defensive stocks are likely to remain in play.
- With the small size of the Singapore market, the STI will continue to track the bigger markets in the region. At current valuations, valuations for the STI are not expensive versus other regional markets and its own historical trends. At current levels, the STI is trading at -1 standard deviation below the historical average for both price-earnings and price-book.
Carmen Lee
OCBC Investment Research
|
https://www.iocbc.com/
2018-12-06
SGX Stock
Analyst Report
3.960
SAME
3.960
OCBC Investment Research | Singapore Strategy 2019
Strategy 2019 – Need retail therapy? Buy Local!
Singapore Banks – Trade war won’t break the banks!
Singapore Residential Sector – Tough love for a sustainable future
Singapore REITs – Roll out the defensive shield for 2019
Singapore Hospitality – Get ready to surf the wave!
Singapore Industrials – Opt for resilience and low valuations
Singapore Telcos – Stick To The Defensives
2019 Stock Picks – Value Over Growth; Stable and Sustainable Dividends