 |
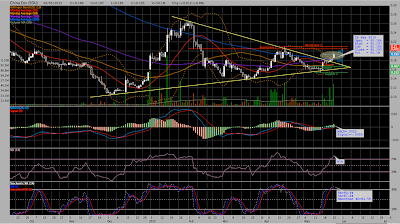
| China Environment Ltd (5OU) Technical Chart 2015-05-26 |
(click on the image to view larger chart)
The 100 days and 200 days moving average coincidentally crossed over at the same time too. It seems that the major moving averages are heading to the same direction now. However, the RSI is already at its overbought region.

