 |
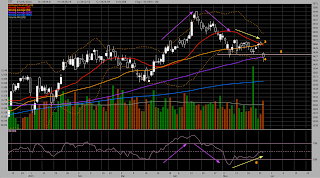
| The Straits Times Index (STI) Technical Chart A 2015-05-27 |
(1) the STI broke the triangle from another direction. Bad.
(2) the parallel uptrend was also broken. Bad.
 |
| The Straits Times Index (STI) Technical Chart B 2015-05-27 |
(3) 20 days moving average crossed over 50 days moving average. Bad.
(4) The STI was traded below its 100 days moving average today. Bad.
(5) The support of previous low was broken, and formed a lower low. Bad.
(6) It seems that RSI has formed a higher high while STI formed a lower high, causing a RSI negative reversal. Bad.
However, US and Europe markets were closed in green. Will the STI give us another surprise later?
(click on the image to view larger chart)

