 |
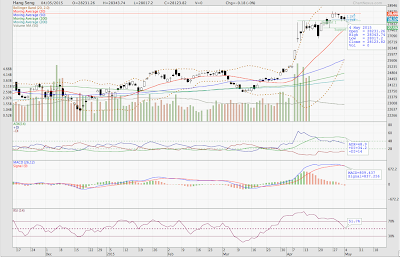
| The Hang Seng Index HSI Technical Chart 2015-05-04 |
It is another day of tug of war between the buying and selling forces. Even though the HSI still didn't manage to breakthrough the immediate resistance, the current support is much stronger than expected. Despite the crossing over of MACD signalling the reversal of uptrend, RSI indicator is now at the level of 50 which implies the HSI is no longer in the overbought region.
Your comments are most welcome and appreciated.
(click on the image to view the larger chart)


